
What Is Moving Average Convergence/Divergence (MACD)?
MACD Line :-
The MACD line is calculated by subtracting the 26-period EMA from the 12-period EMA.
The result of that calculation is the MACD line.
Signal line :-
A 9 day EMA of the MACD line is called the signal line.
which can function as a trigger for buy or sell signals.
The basic interpretation of the MACD indicator is:-
1)When the MACD Line crosses the centerline from the negative territory to positive territory, it means there is a divergence between the two averages. This is a sign of increasing bullish momentum; therefore, one should look at buying opportunities
2)When the MACD line crosses the centerline from positive territory to the negative territory, it means there is a convergence between the two averages. This is a sign of increasing bearish momentum; therefore, one should look at selling opportunities.
Simple 2 line crossover strategy with these two lines (MACD & Signal Line):-
1)Buy signal:- when the MACD line crosses above the signal line as shown below.
If MACD is above the signal line, the histogram will be above the MACD’s baseline, or zero line.
Note for Buy confirmation : MACD line should be above zero and Above Signal line

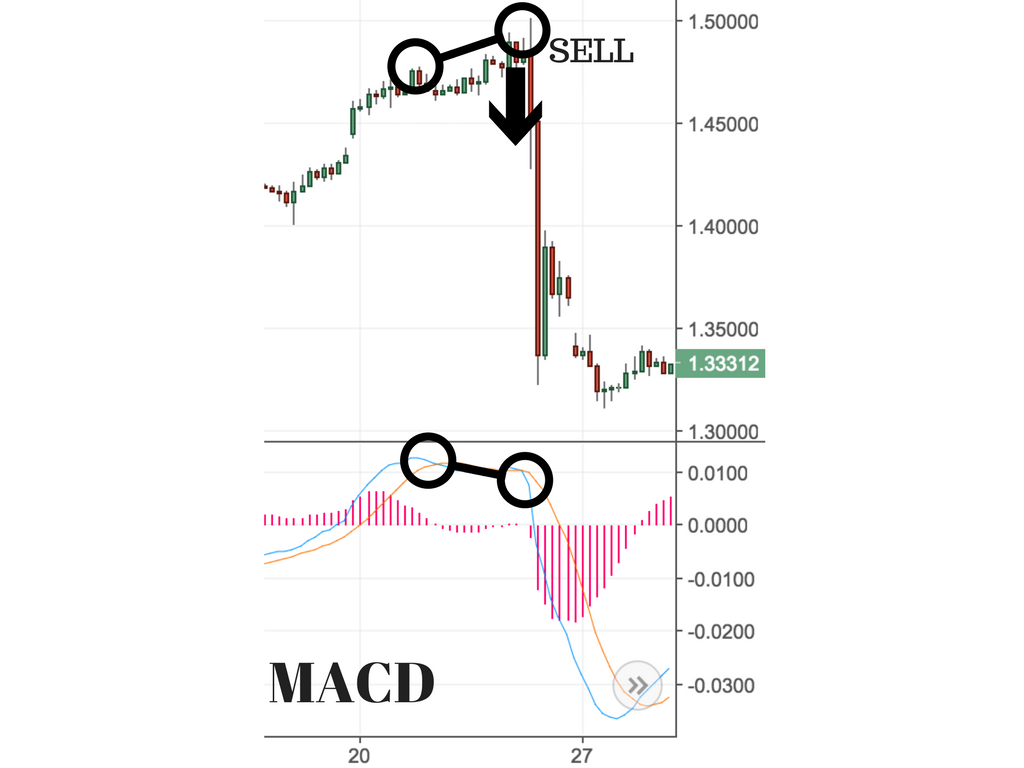
2)Sell Signal or short :- when the MACD line crosses below the signal line as shown below.
Note for sell confirmation :– If MACD is below its signal line, the histogram will be below the MACD’s baseline
Note:-
1)MACD line crossing above zero is considered bullish, while MACD line crossing below zero is bearish.
2)Secondly, when MACD turns up from below zero it is considered bullish.
When it turns down from above zero it is considered bearish.